 Web Panel
A browser-based management interface embedded in the VulpineOS binary for monitoring every AI browser agent in your fleet. Access the full dashboard, agent management, and configuration from any browser.
Starting the Web Panel
Start the served control plane:
./vulpineos serve --host 0.0.0.0 --port 8443 --no-tls --api-key $VULPINE_API_KEYIf --api-key is omitted in serve mode, VulpineOS generates one at startup and
prints both the access key and a direct panel URL. Open that URL in a browser to
use the web panel.
Connect the remote TUI from another machine:
./vulpineos remote --url http://your-server:8443 --api-key $VULPINE_API_KEYPages
The embedded panel has 12 pages.
Dashboard
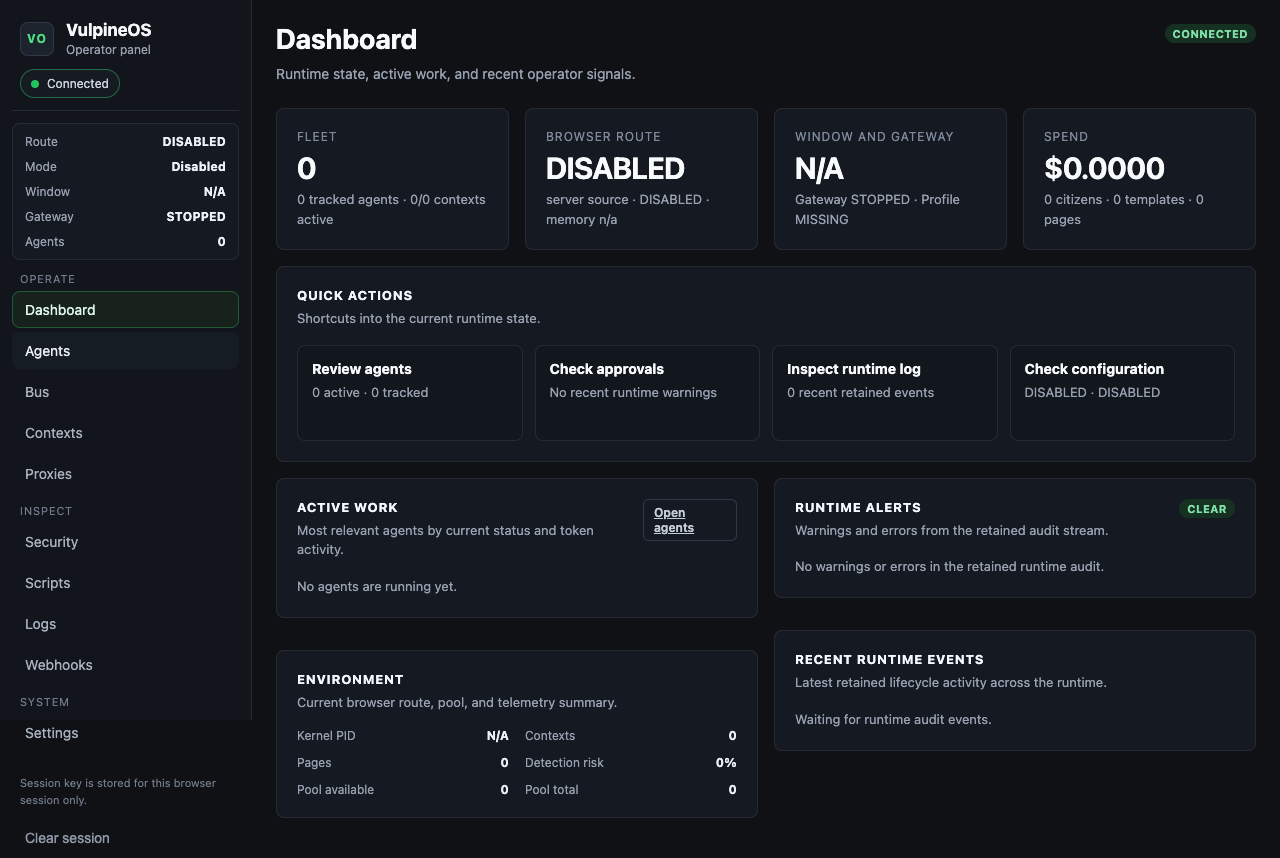
Operator overview: browser route, mode, window state, gateway/profile readiness, active agent count, pool utilization, spend, and telemetry. The dashboard also surfaces quick links into active work, retained runtime alerts, recent runtime events, default-budget posture, and a compact active-agent preview instead of only a few coarse status cards.
Agents
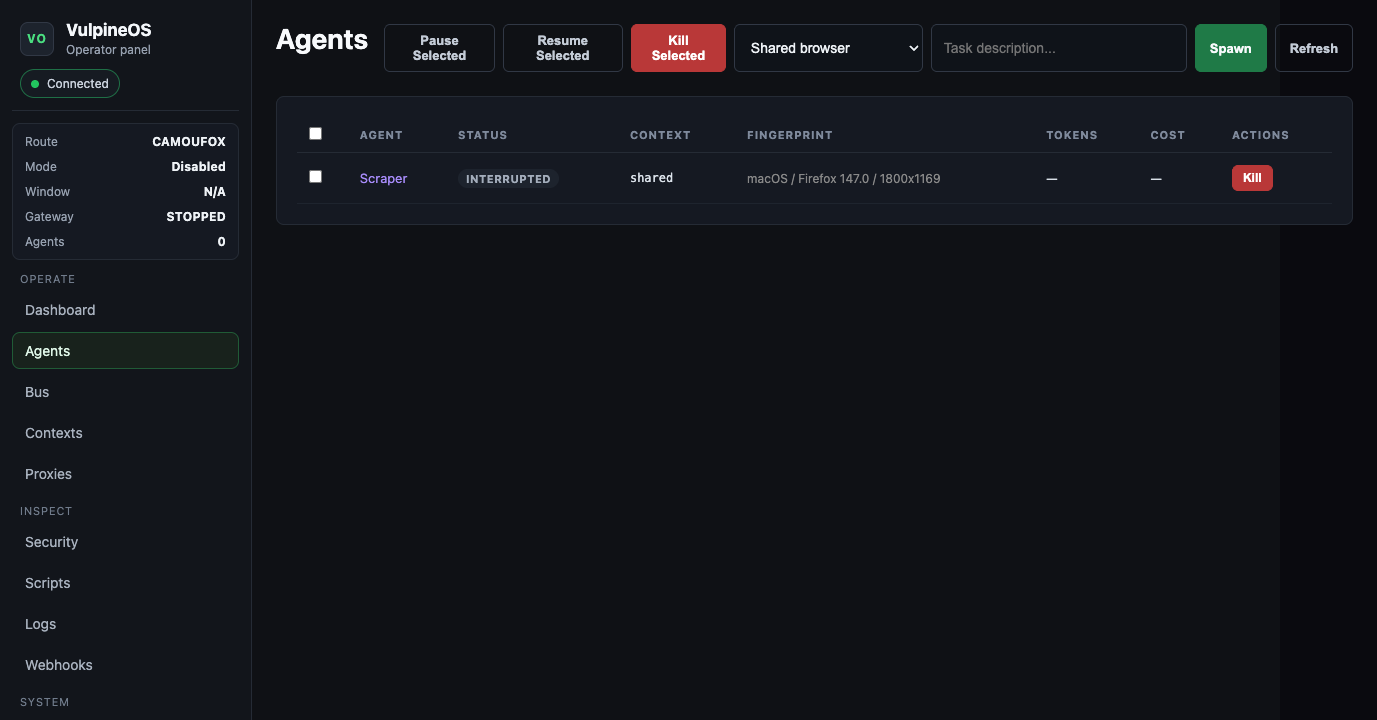
Agent list with status, fingerprint summary, token usage, cost per agent, and budget source/limit summaries. The page also surfaces aggregate spend, tracked token totals, the persisted default budget, and how many agents are running with explicit overrides. Spawn new agents with a task description. Kill or pause running agents. Click an agent to open its detail page.
Agent Detail
Five operator views:
- Conversation — Full message history with role-colored entries (user/assistant). Send messages to the agent via text input.
- Trace — Tool calls, result summaries, and detected failed-action warnings.
- Raw — Live agent session log stream with exact JSONL records.
- Recording — Action timeline showing timestamped browser actions (navigate, click, type, scroll, screenshot), with JSON export.
- Fingerprint — JSON view of the agent’s assigned fingerprint (user agent, screen dimensions, WebGL, etc), with regenerate-and-apply controls.
Bus
Dedicated operator page for agent-to-agent approvals and communication policies. Review pending delegate/ask traffic, approve or reject individual messages, and define saved auto-approval rules between agent pairs.
Contexts
Create and remove browser contexts. Lists active contexts with IDs. Contexts are isolated — separate cookies, storage, and fingerprints per context.
Proxies
Import proxies in bulk (one URL per line). Test proxy latency and resolve exit country. Delete individual proxies. Shows URL, status (tested/untested), latency, and country.
The same page also includes a per-agent rotation editor: choose the target agent, select a proxy pool, and persist rotation rules for rate-limit triggers, block triggers, interval-based rotation, and fingerprint sync.
Security
Runtime-backed protection status page. It now reflects what the runtime actually has active, available, or disabled instead of hard-coding everything as active. The same page still shows live injection attempts from Browser.injectionAttemptDetected events.
Webhooks
Add webhook endpoints with optional event filtering and secret headers. Remove registered webhooks. Events: agent.completed, agent.failed, agent.paused, rate_limit.detected, injection.detected, budget.alert, budget.exceeded.
Scripts
JSON script editor for the agent scripting DSL. Scripts now execute through the server-side scripting engine against a real browser context, and the page shows step-by-step execution results plus captured variables.
Logs
Two operator views live here:
- Runtime Audit — persisted kernel, foxbridge, and agent-runtime lifecycle events so restart and crash history survives reconnects and process restarts.
- Event Stream — live filterable WebSocket event feed with timestamp, method, and params.
Login
Access-key login screen for served panel access. The panel stores only the key
needed to authenticate its WebSocket session. If you open the panel through a
printed tokenized URL, the key is bootstrapped automatically and removed from
the visible address bar after load. Manual login validates the key through
/auth/check before opening the websocket.
Settings
Configure LLM provider, model, and API key (persisted to ~/.vulpineos/config.json). Persist default agent budgets (USD + token ceiling). Kernel info: binary path, auto-restart status, context pool configuration. Source-closed extensions can add extra status panels through the same runtime interfaces, while the public panel keeps those sections clearly unavailable when no provider is attached.
API Communication
The panel communicates via WebSocket control messages to the ControlAPI
handler. All messages go through the /ws endpoint with access-key
authentication.
19 control message types across 5 domains, verified against internal/remote/control.go:
| Domain | Messages |
|---|---|
| agents | list, create, spawn, kill, pause, pauseMany, resume, resumeMany, killMany, getMessages, getSessionLog |
| config | providers, set |
| proxies | add, delete, test |
| settings | get, skills.set |
| status | get |
Example message flow:
// Connect with access key
const ws = new WebSocket("wss://server:8443/ws?token=API_KEY");

// Send control message
ws.send(
  JSON.stringify({
    type: "control",
    payload: JSON.stringify({
      command: "agents.list",
      params: "{}",
    }),
  }),
);

// Receive response
ws.onmessage = (e) => {
  const msg = JSON.parse(e.data);
  // Control response: { type: 'control', payload: '{"agents": [...]}' }
  // Live event: { type: 'juggler', method: 'Browser.telemetryUpdate', params: {...} }
};
Real-time events (telemetry, injection alerts, agent status, runtime audit events) are broadcast automatically to all connected clients.
The operator UI now surfaces connecting, reconnecting, and failed websocket states inline and retries dropped sessions with exponential backoff.
The panel shell now also groups navigation by operator workflow and keeps live runtime context in the sidebar so route, mode, window state, gateway state, and active agent count stay visible while moving between pages.
Single Binary
The web panel’s static assets (HTML, CSS, JS) are embedded in the Go binary
using //go:embed. No external web server is needed — vulpineos serve starts
the kernel, foxbridge CDP proxy, and web panel from a single binary.
See also
- TUI Workbench — terminal dashboard for managing agents
- Remote Access — deploy VulpineOS on a VPS with WebSocket
- Agent-to-Agent Communication — message bus with approval policies